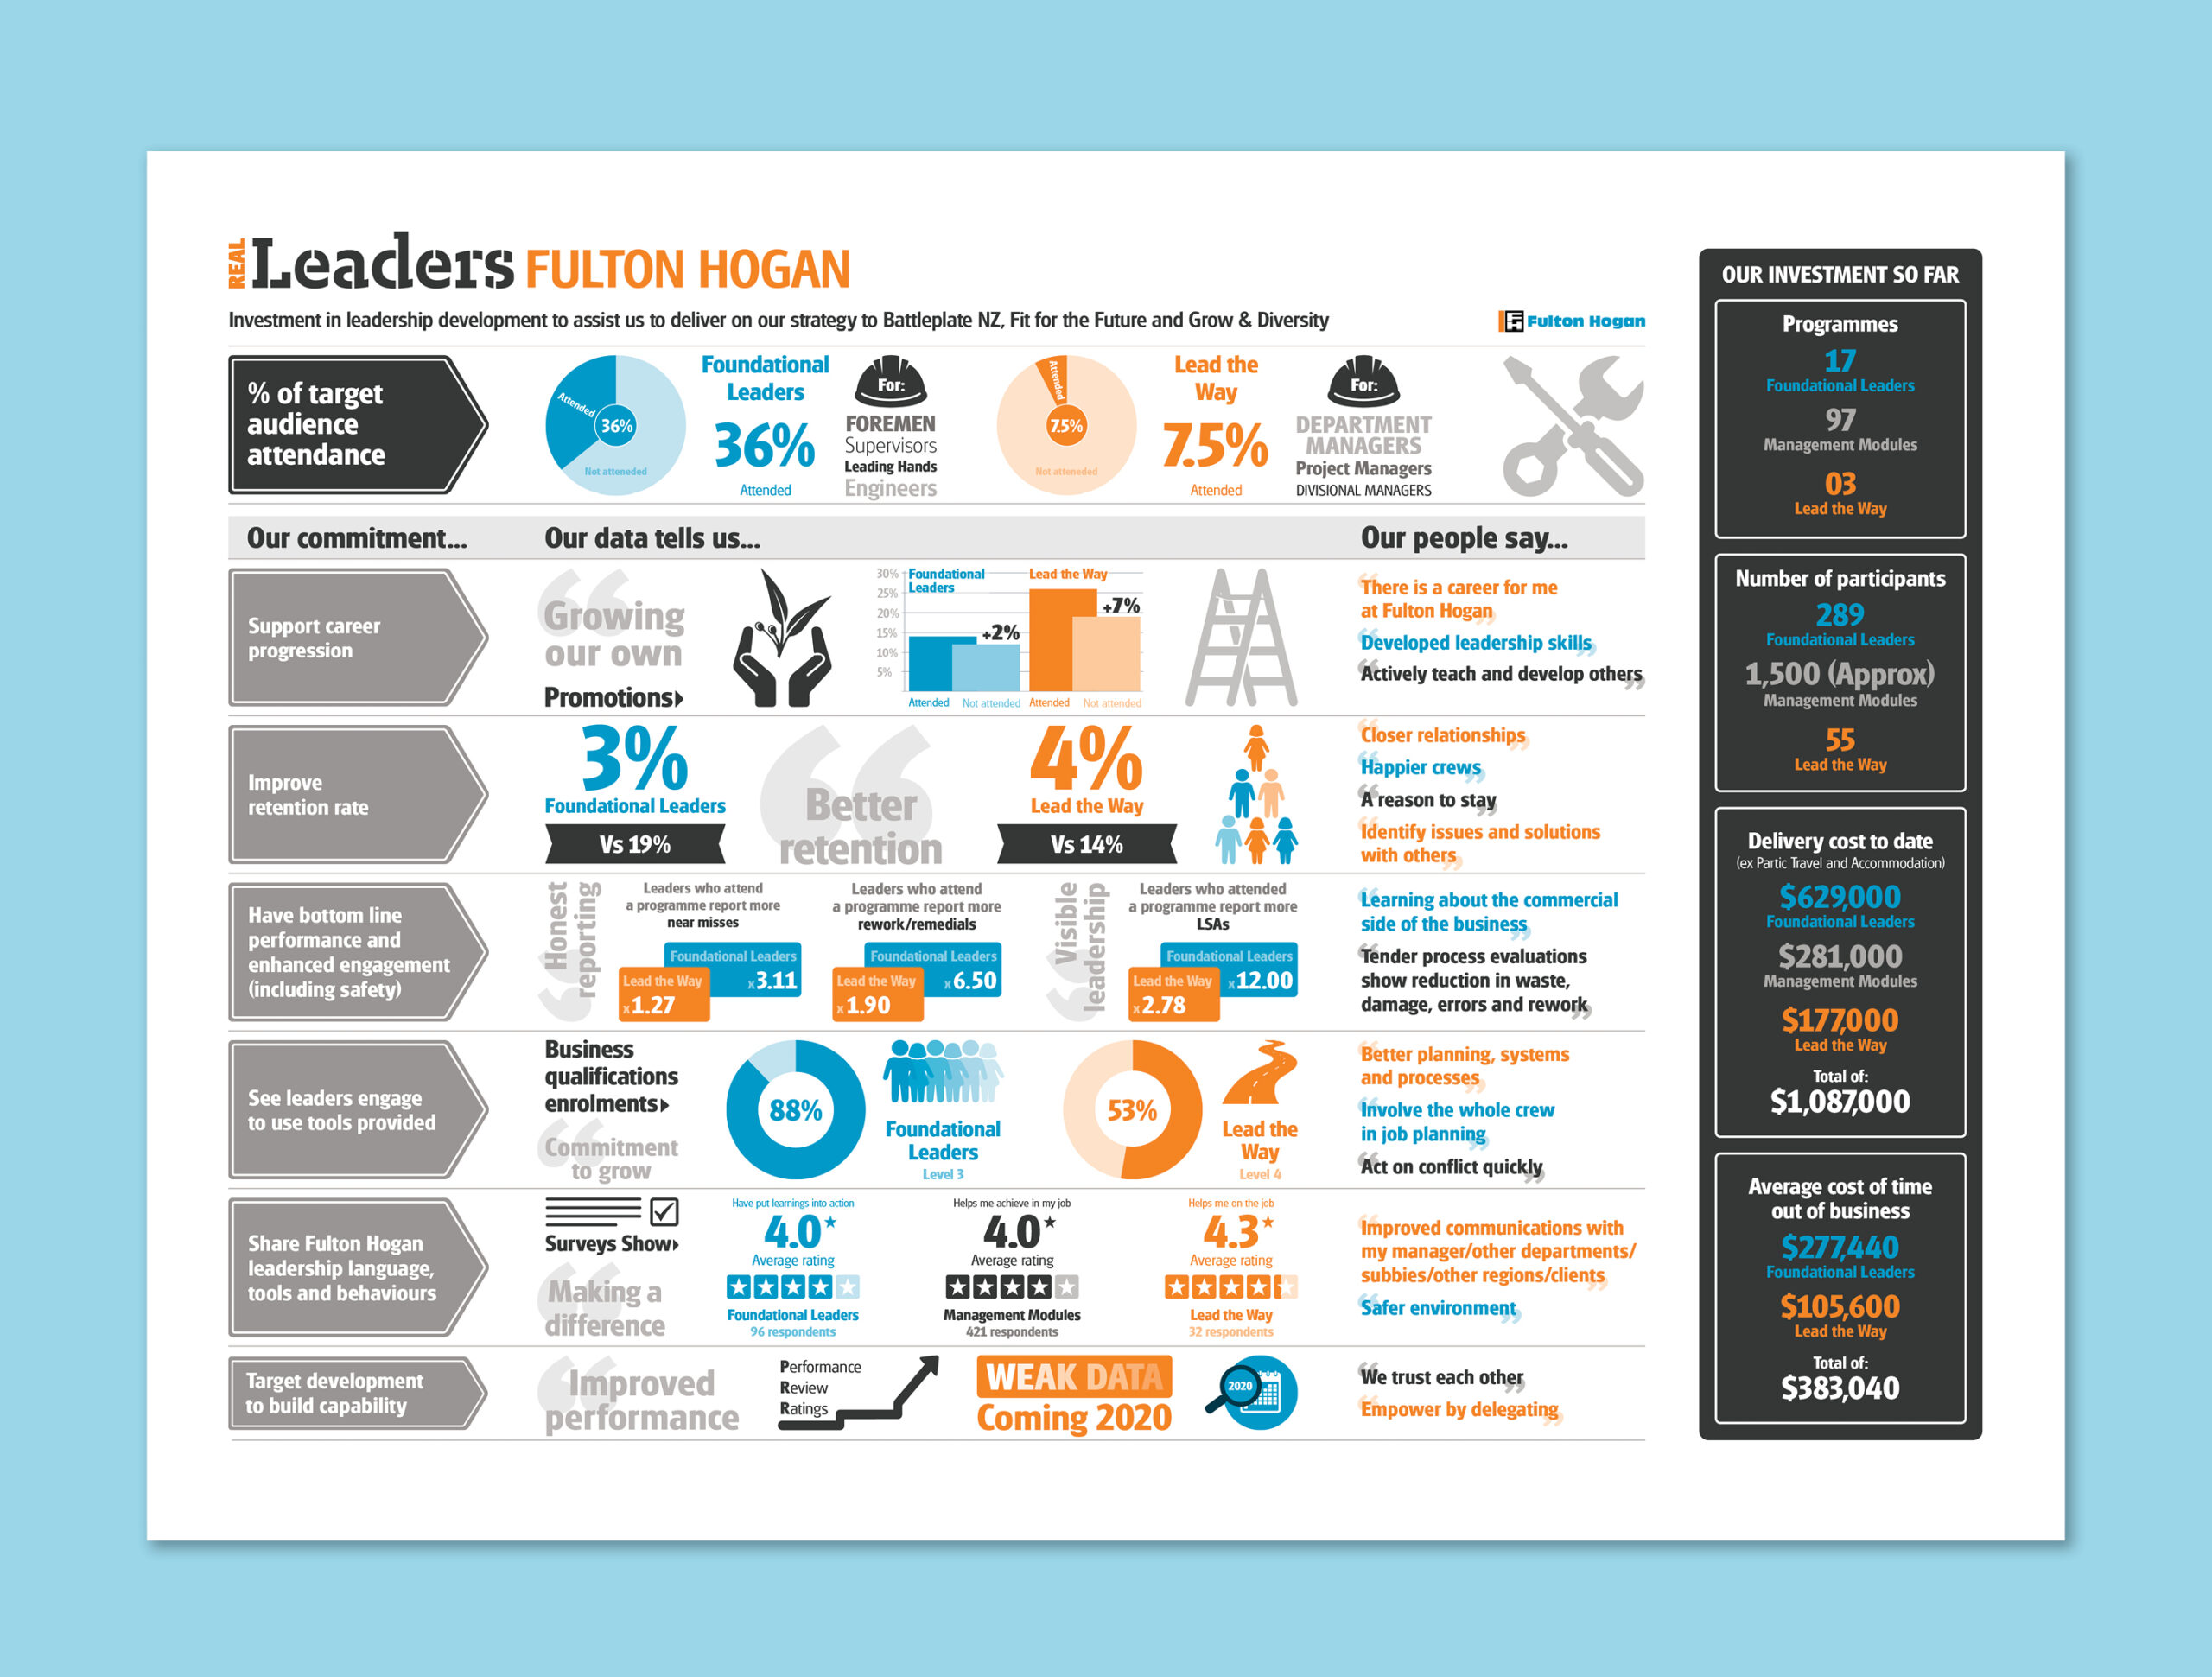
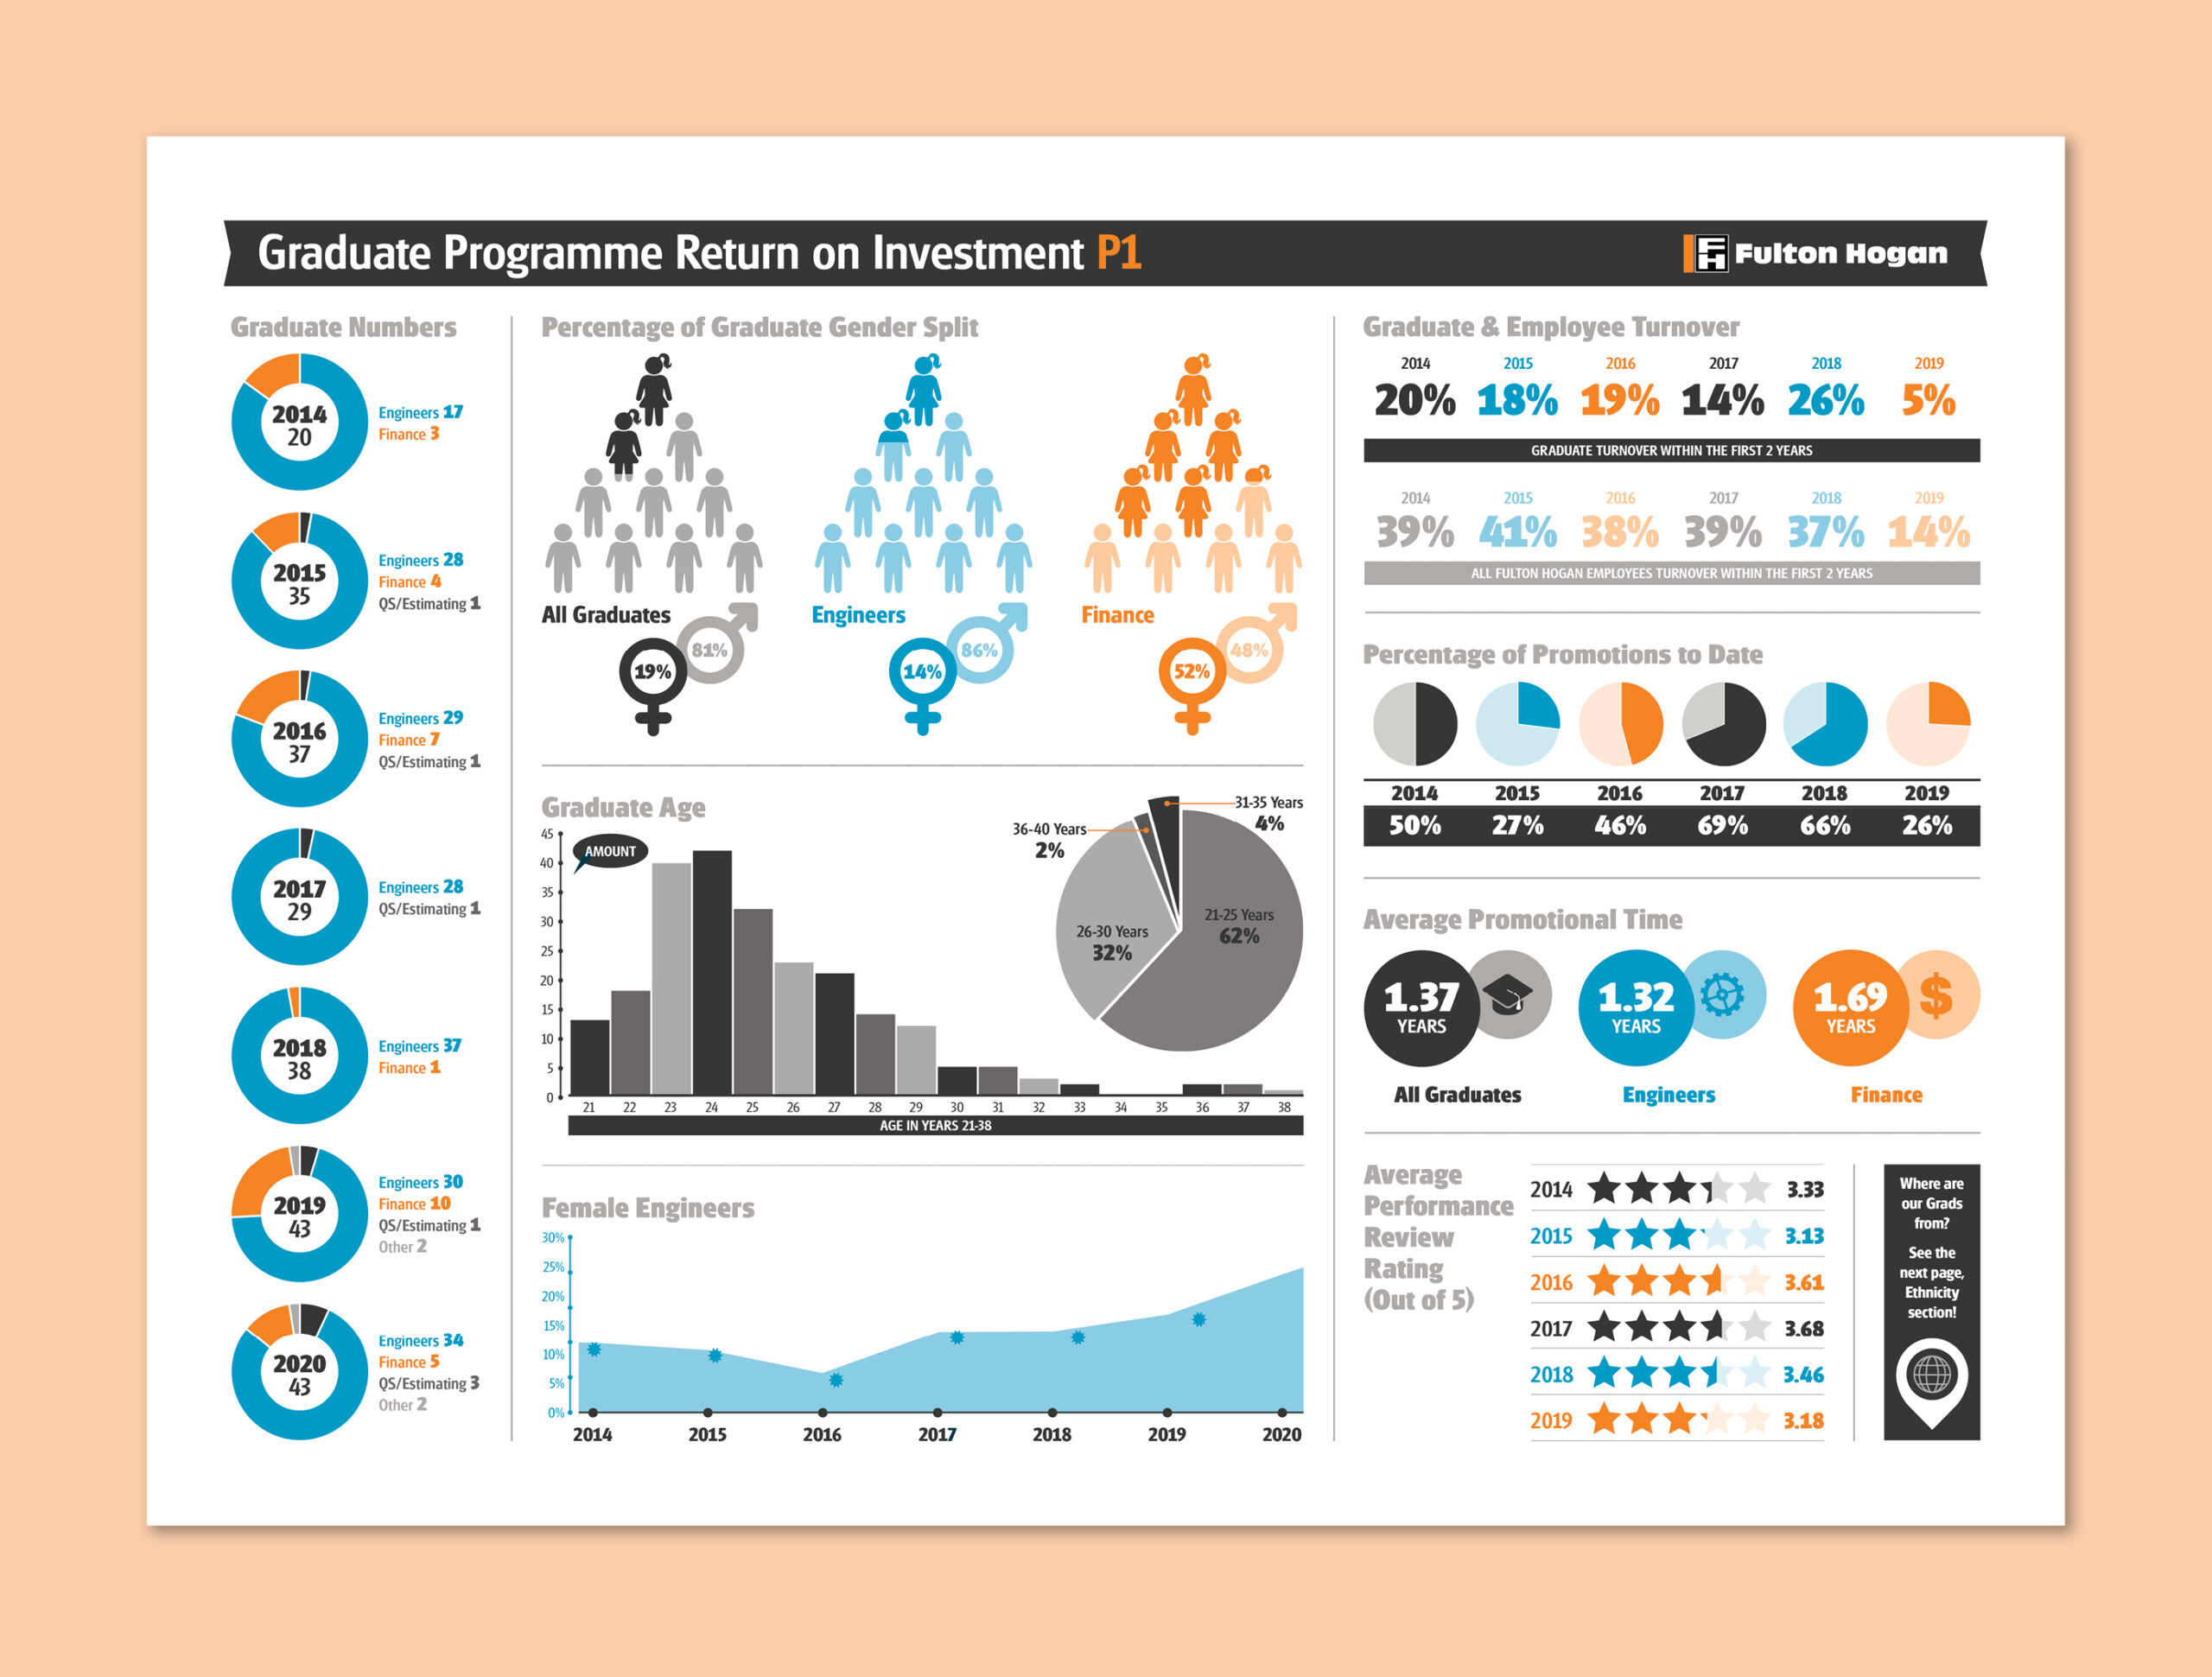
Using the graph tool in Adobe Illustrator, and creating some icons, I design these visual representations of facts and figures that were given to me in Excel format They were then imported into Adobe InDesign to create the typography and finalise into A3 formats. The two infographic documents displayed here are the Graduate Programme Return on Investment and REAL Leaders. For these designs I used only the company’s primary colours including tints of them.